Our municipal water supply monitoring solutions support accurate flow measurement and water distribution monitoring, helping utilities manage water resources and maintain stable supply systems.
Get a Quote →Municipal water supply monitoring is the continuous measurement of flow, pressure, reservoir level and water quality across a public water network, from the treatment works and storage tanks through trunk mains to district areas and large consumers. The data is sent to a central system so that operators can follow demand, control pumping, spot leakage and confirm that delivered water meets service requirements.
A monitoring program normally combines field instruments, data loggers or remote terminal units, a communication link and software for alarms and reporting. This page explains the main monitoring points, how common instruments compare, which factors affect reliability in buried or remote sites and what buyers should check before ordering equipment for a water utility project.
Flow and Consumption
Flow data at treatment outlets, district inlets and bulk customers shows demand patterns and supports water balance calculations.
Network Pressure
Pressure readings reveal supply problems, pump faults, valve operations and bursts, and are central to pressure management programs.
Reservoir and Tank Level
Level monitoring helps balance storage against demand, schedule pumping and prevent overflow or running dry.
Water Quality Indicators
Residual disinfectant, turbidity, pH and temperature are tracked at key points to confirm that water stays within quality targets.
Pump and Valve Status
Run status, energy use and valve position records support maintenance planning and help explain unusual pressure or flow changes.
Alarms and Events
Threshold alarms for high flow, low pressure or tank level extremes allow quick response before customers are affected.
Many utilities split the network into district metered areas. A flow meter and a pressure sensor at the inlet are connected to a data logger, which stores readings and reports them to the control center on a set schedule.
Comparing inlet flow with the sum of customer meter readings shows how much water is lost, and night-time minimum flow is a widely used early indicator of leakage in the district.
The table gives a general overview of typical field instruments. Choice depends on pipe size, power availability and the required data interval.
| Instrument | Measures | Typical Location | Common Power | Common Communication |
|---|---|---|---|---|
| Electromagnetic flowmeter | Flow volume | Treatment outlet, district inlet | Mains or battery | Pulse, Modbus, cellular |
| Ultrasonic flowmeter | Flow volume | Trunk mains, retrofit points | Mains or battery | Pulse, serial, wireless |
| Pressure transmitter | Line pressure | Hydrants, critical points | Loop or battery | Analog, logger |
| Level sensor | Tank level | Reservoirs, tanks | Loop or solar | Analog, RTU |
| Water quality analyzer | Chlorine, turbidity, pH | Plant outlet, key nodes | Mains | Analog, digital bus |
| Data logger or RTU | Collects and sends data | Chambers, stations | Battery, solar or mains | Cellular, radio, wired |
Chambers can flood and sit underground, so ingress protection and low-power design are often decisive when comparing similar instruments.
Outlet flow and quality readings record what enters the network and support production reporting.
Flow, pressure and energy data show pump duty and help schedule pumps for efficient operation.
Level and outlet flow information balances storage with demand and supports emergency planning.
Pressure and flow at key valves help detect bursts and verify the effect of operational changes.
Inlet meters and critical point pressure loggers form the basis of leakage control and pressure management.
Large consumer meters support billing and make unusual consumption easy to identify.
Recommended Practice
Frequent Problems
Communication Options
Cellular networks, low-power radio and wired links all appear in water networks. The best choice depends on coverage, data volume and the number of sites.
Power Planning
Battery-powered units reduce installation cost at remote chambers, while mains or solar power suits stations that need frequent readings.
Sensor Care
Check sensor faces, electrodes and tappings on a schedule, and clean deposits as described in the manufacturer manual.
Calibration and Data Review
Periodic verification, along with regular checks of trends and gaps in the data, keeps the monitoring program trustworthy.
Site data: pipe size and material, flow or pressure range, chamber conditions and expected installation depth.
Protection rating: ingress protection suited to flooding and a suitable cable and gland arrangement.
Interfaces: output signals, protocol and communication module matched to the existing platform.
Approvals and records: potable water contact approvals, calibration certificates and test reports where required.
Lifecycle support: expected battery life, spare parts supply and technical assistance for commissioning.
Tip: A site list with pipe sizes, power availability and signal coverage notes lets a supplier propose one consistent set of instruments for the whole project and avoids mixed configurations.
It gives operators a continuous picture of flow, pressure, storage level and water quality across the network. This information supports daily operation, leakage control, planning and reporting to regulators and customers.
It is a defined section of the network with a limited number of inlets, each fitted with a flow meter. Because inflow is measured, the utility can compare it with customer consumption and estimate losses within that area.
Electromagnetic flowmeters are widely used for full pipes because they have no moving parts and little pressure loss. Ultrasonic meters, including clamp-on versions, are common for retrofit work and where cutting the pipe is difficult.
Pressure changes can signal bursts, closed valves, pump problems or demand spikes. Controlling pressure also reduces leakage and stress on pipes, so many utilities log pressure at inlets and at the most demanding points.
At night customer demand is low, so the minimum flow into a district is mostly leakage and a small amount of legitimate use. A rise in this minimum over time often points to a new leak that deserves investigation.
Yes. Many loggers and some flow meters are designed for long battery operation in remote chambers. Battery life depends on reading interval, transmission frequency and temperature, so confirm the expected life under your planned settings.
Instruments usually connect to a logger with an antenna that is routed to a position with usable signal, often through an external antenna on the chamber cover. Cellular and low-power radio links are common choices.
Materials that touch potable water are often subject to local approval schemes. Requirements differ by country, so confirm them in the project specification and request supporting certificates from the supplier.
Intervals depend on the instrument, its role and the rules of the utility. Billing and balance meters are normally checked more often than general monitoring points, and records should be kept for each verification.
Provide the monitoring purpose, pipe size and material, measurement range, power and communication conditions, ingress requirements and the target platform. A list of sites with brief notes on each location also helps the supplier.
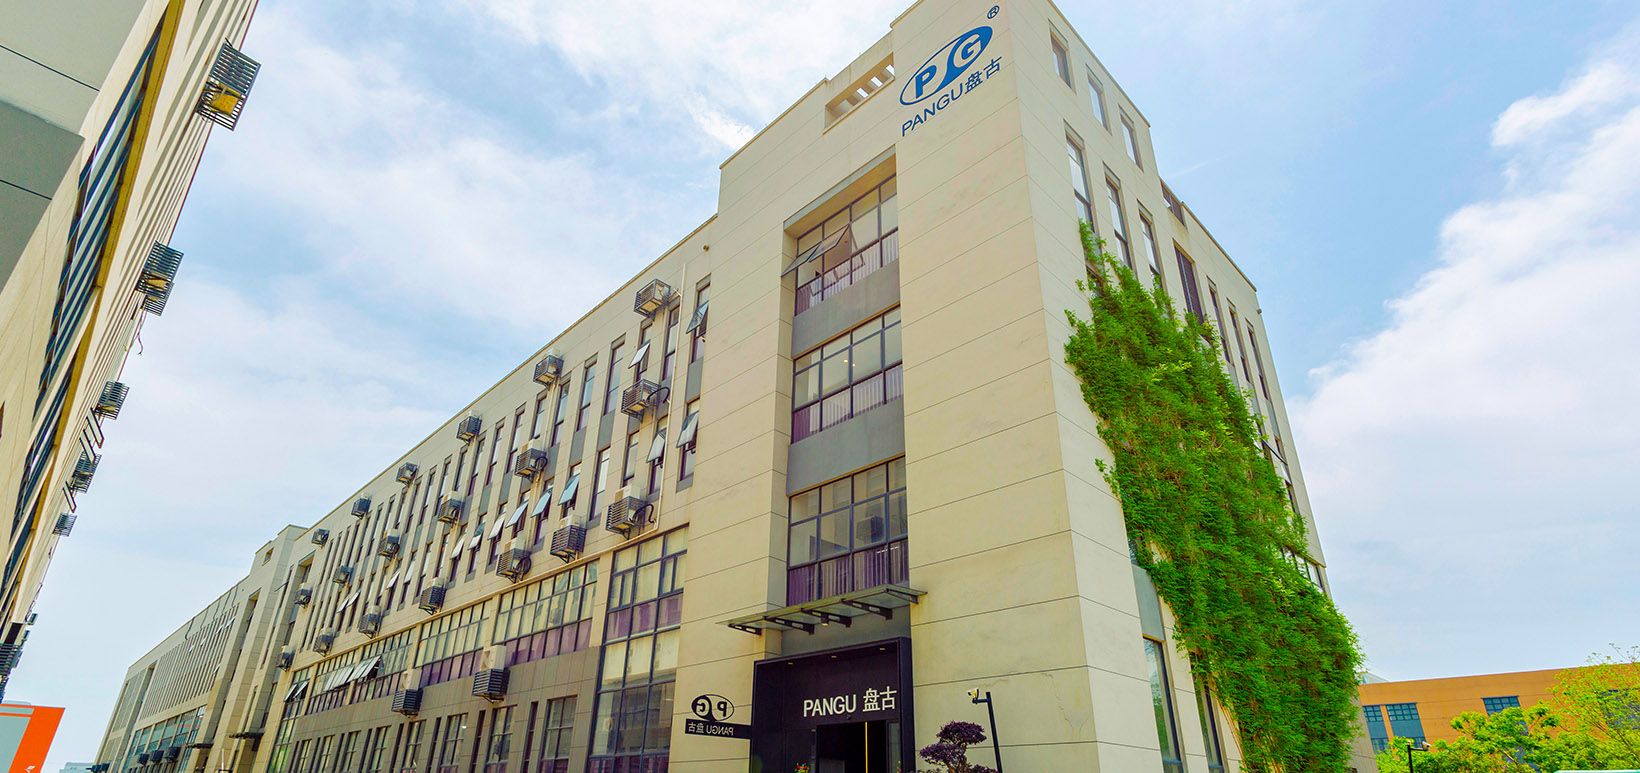
Hangzhou Pangu Automation System Co., Ltd. is professional China wholesale Municipal Water Supply Monitoring Solution manufacturers and Municipal Water Supply Monitoring Solution suppliers, with strict quality control and years of industrial application experience.
 Aging Chamber
 High-Speed Chip Mounter
 Glue Dispensing Machine
 Potting Process
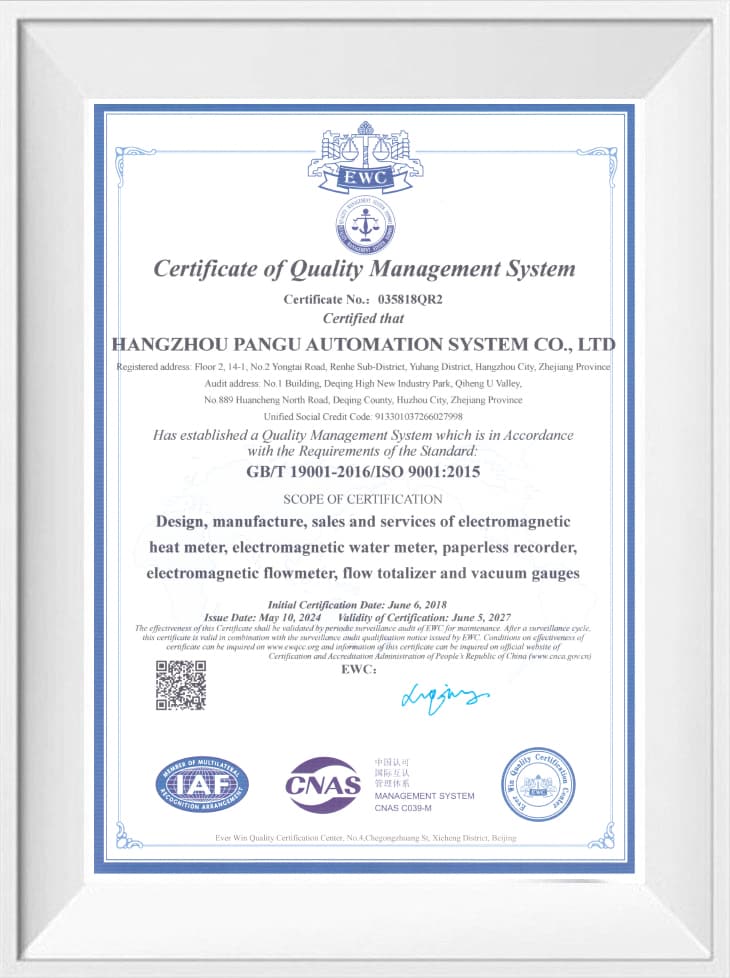 Quality Management System Certification
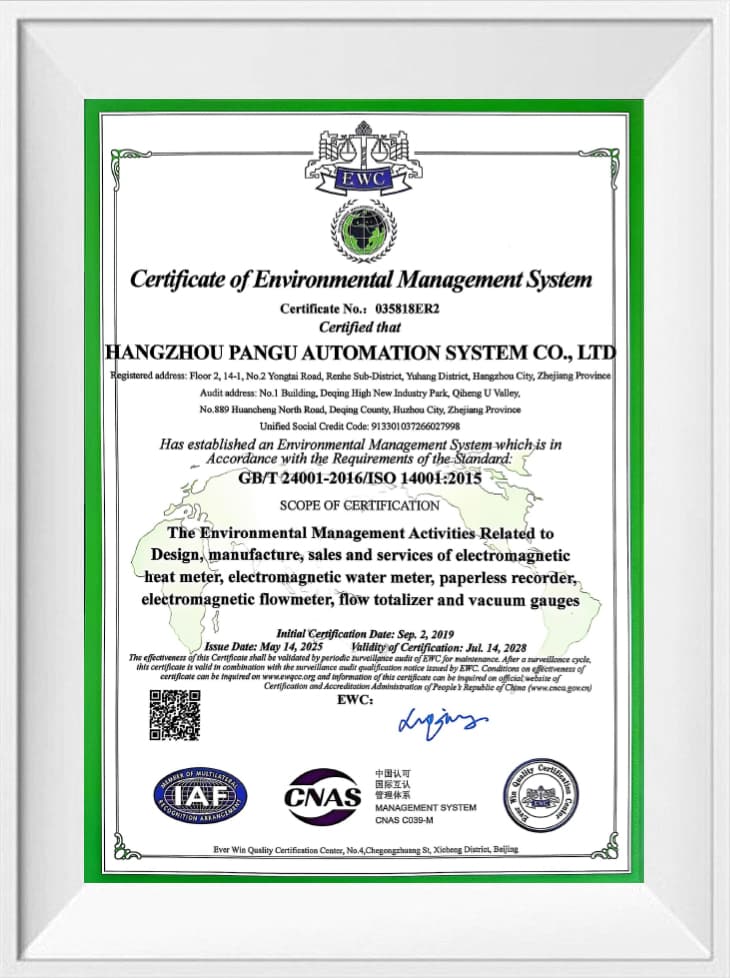 Environmental Management System Certification
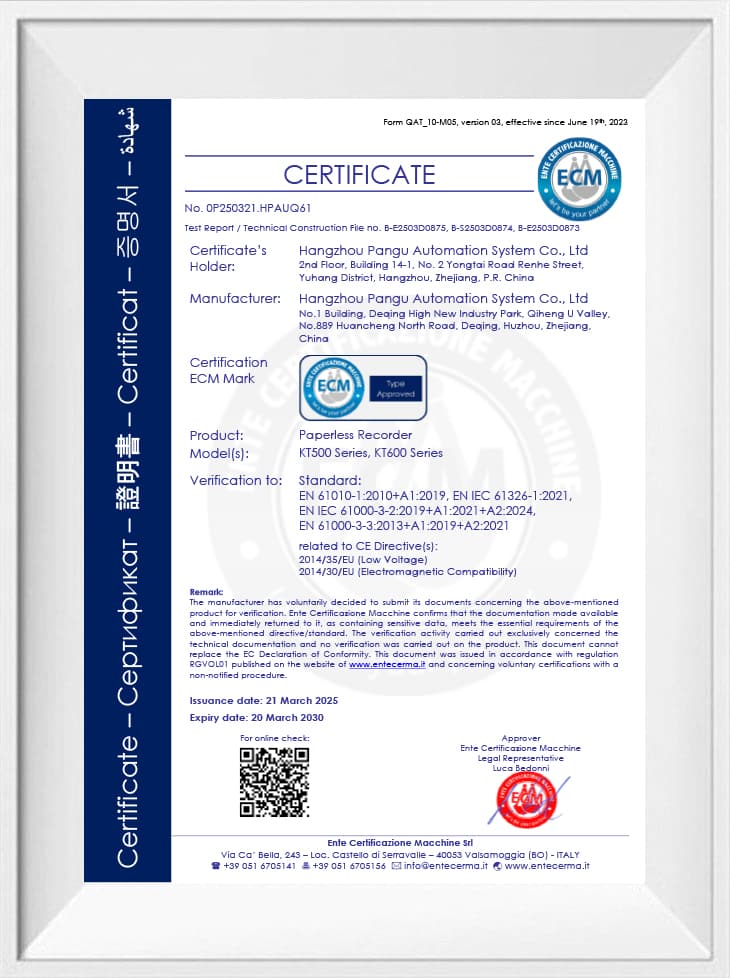 CE Certificate
 SIL Certificate
Yes. Send us your requirements and we will propose a solution.
Standard models ship quickly; custom orders depend on quantity.
Tell us your requirements and our engineers will reply promptly.
✉pangusales@vip.163.com
☎+86 13967196545
⚑602-702, Block D, Building 3, Area B,Xigang New Territories, 206 Zhenhua Road,Hangzhou City, Zhejiang Province, China